
AI creation
Prompt to chart
Describe the message, audience or visual you need. Storycards creates the data structure, composition and editable first draft.
- Natural-language creation
- Project-aware follow-up edits
- Structured output, never a screenshot
Storycards features
AI research, structured data, full design control, live connections, team workflows and publisher-scale delivery — all in one professional workspace.
AI & research
Move from an open question or a ready dataset to an editable first draft without turning your work into a flattened AI image.
AI creation
Describe the message, audience or visual you need. Storycards creates the data structure, composition and editable first draft.
Cited research
Research public sources, compare evidence and build a typed dataset with the citations kept close to the claims.
Project chat
Ask questions, refine copy, change a chart or edit the layout in the context of the current project.
Plan before build
Storycards can propose a clear build plan before a major creation or data replacement, while small edits stay immediate.
Visual intelligence
Get chart and template recommendations based on the message, the shape of the data and how readers need to use it.
Data & connections
Work with structured data from the start, then choose whether Storycards, a spreadsheet or an external system remains the source of truth.
Structured data editor
Use a typed table or workbook, change values and columns, map fields, review the source and watch the visual update without rebuilding it.
Files & paste
Upload Excel, CSV, TSV or JSON, paste a copied table and review the inferred column types before creating.
Google Sheets
Connect an existing Sheet or create one from a Storycards table. Update the spreadsheet and keep the visual current.
Live API
Read JSON, CSV or TSV endpoints, test mappings and support authenticated connections without exposing credentials to readers.
Connector catalog
Discover supported public datasets and reusable API connections instead of rebuilding the same integration for every project.
Private connections
Authenticated suppliers are fetched server-side. Published readers receive a safe snapshot, never the API key or source account.
AI Connector · MCP
Turn a prompt, dataset or research question into an editable infographic or interactive map through an MCP-compatible AI tool.
Explore Storycards ConnectorVisuals & editing
Use AI for speed, then work directly with the same components, breakpoints and interactions that will reach your audience.
Visual library
Build charts, rankings, maps, polls, comparisons, dashboards, sports visuals, sliders, reveals and scroll-led visual stories.
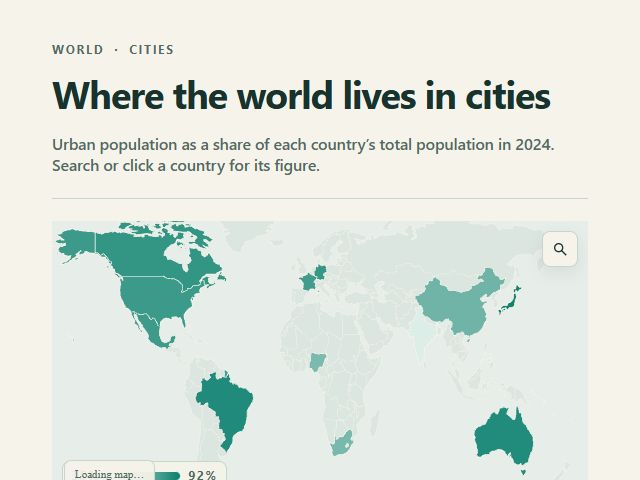 SELECTED COUNTRYBrazilUrban population · 87.8%
As the new line opened, the busiest morning corridor moved east.
Scroll to continue ↓Interactive maps
Create choropleths, searchable point maps, routes, 3D data-height stories and reader-controlled time comparisons from structured data.
2024 · Country viewColor = urban share · Search + inspect
Contextual Inspector
Edit chart type, field mappings, axes, colors, typography, images, spacing and individual data marks without hunting through a generic settings wall.
Responsive layouts
Preview breakpoints, tune layout and publish a visual that adapts to the space around it.
Images & media
Upload images, use data-bound photos, control crop and fit, and combine media with charts, labels and editorial composition.
Motion
Apply and replay editorial entrance motion with timing controls designed for data and reader attention.
Reader interaction
Add tooltips, annotations, buttons, hover states and format-specific interaction without shipping a custom front-end.
Composition tools
Add text, sources, shapes, buttons, images and multiple visual components to create a complete graphic or visual story.
Brand & languages
Turn brand decisions into reusable rules so teams can move quickly without making every infographic look the same.
Brand Kits
Save palettes, typography, logos, assets, spacing and visual rules, then apply the complete identity across a project.
Fonts & assets
Work with product fonts, Google Fonts and Brand Kit fonts alongside reusable logos and media assets.
House templates
Give the organization approved starting points for recurring coverage, branded packages and everyday production.
Localized publishing
Create multilingual editions while keeping the data, visual structure and Brand Kit connected across versions.
Teams & control
Organize production around real teams and roles, while keeping personal drafts, organizational assets and project history explicit.
Team workspaces
Create inside a Team for shared work or keep an early draft Private. Move projects deliberately when the audience or ownership changes.
Roles & permissions
Owners, Managers, Editors and Viewers get clear responsibilities, with Team membership controlling which work they can open.
Shared project context
Keep project chats and their authors together so a teammate can understand the work and continue from the same context.
History & restore
Review draft revisions and published versions, restore safely and keep a visible production history around the project.
Publishing & scale
Deliver responsive visuals through versioned, reader-safe infrastructure designed for live coverage and large audiences.
Smart Embed
Paste one lightweight embed into the CMS. The visual follows its container, reports its own height and collapses cleanly if delivery fails.
Live updates
Refresh supported Sheets and API sources through private server-side snapshots without asking the reader to contact the supplier.
Versioned publishing
Each publish creates a durable version, letting teams move forward, roll back safely or take a visual offline.
Analytics
Track published views, creation and publishing activity, and the organization’s top-performing infographics.
Publisher-scale delivery
Static, versioned CDN assets keep the editor out of the reader path and support large simultaneous audiences.
Delivery controls
Control embed availability and allowed domains while keeping source credentials, private datasets and supplier access outside the public artifact.
The real product, in motion
Short, silent clips from the real Storycards editor. Follow the path from connected data to an interactive, on-brand visual.
Map Studio
Open the map inspector, switch the basemap and refine the visual without leaving the editor.
Explore Map Studio →Data management
Work in a focused table, sync with Google Sheets or move to a different source without rebuilding the visual.
See data features →Live APIs
Start from the source library or configure a custom endpoint with server-side credentials and a safe preview.
Explore live data →Design control
Select the map, adjust its palette and see the result update directly on the canvas.
See editing features →Captured in the Storycards editor
One connected workflow